Key metrics
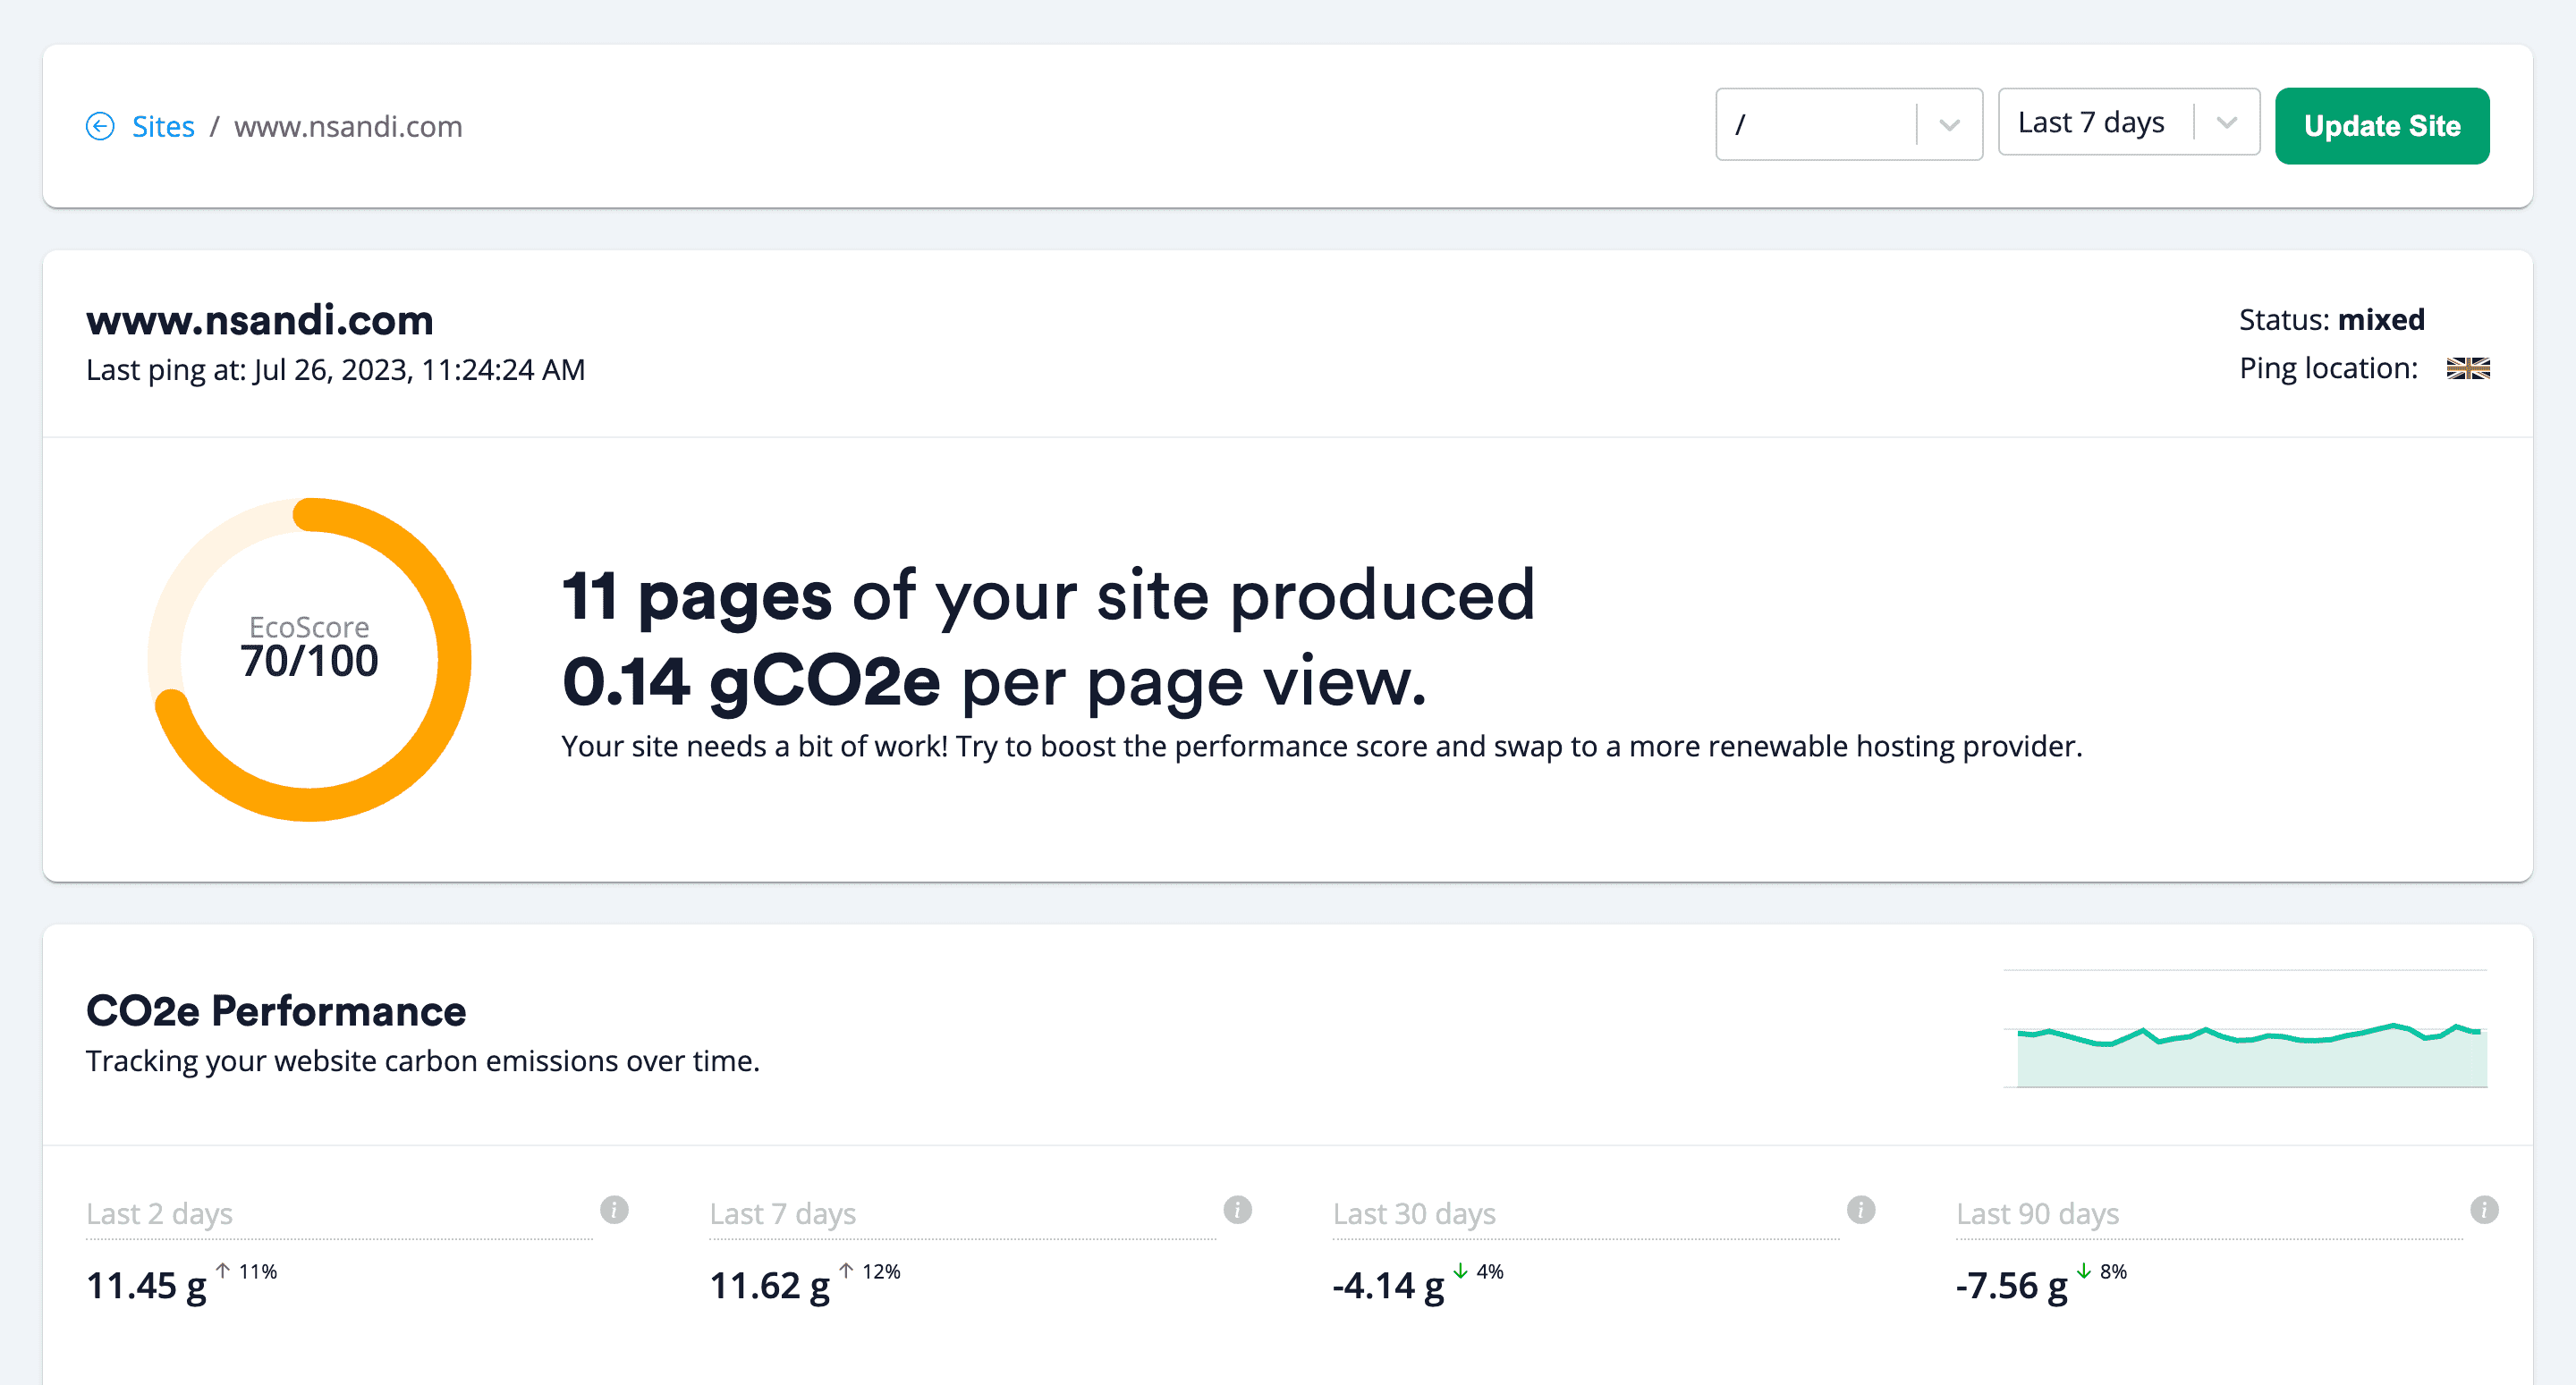
EcoScore EcoScore is our key metric to track how eco-friendly your website is. It's a score out of 100 (over 90 is the goal!) The EcoScore…
Read more »
Every web page produces CO2. And today, it’s amazingly easy to build a seriously polluting website. From images and fonts to CSS and Javascript, every element of every web page is transferred from data centers to our devices – meaning the larger the website, the greater the impact. With every link clicked, every page loaded, every scroll and every moment dwelled, electricity is consumed. A lot of electricity. 416.2 TWh per year, to be precise.
With a 594% growth in mobile page weight over 10 years (why thanks, inefficient and overly extravagant website designs!) and the world hunger for data forever increasing, so to our impact in this intangible area.
So if we're not conscious of what goes into our websites, the internet will increasingly stink. And we all know what that means for the future of our planet…
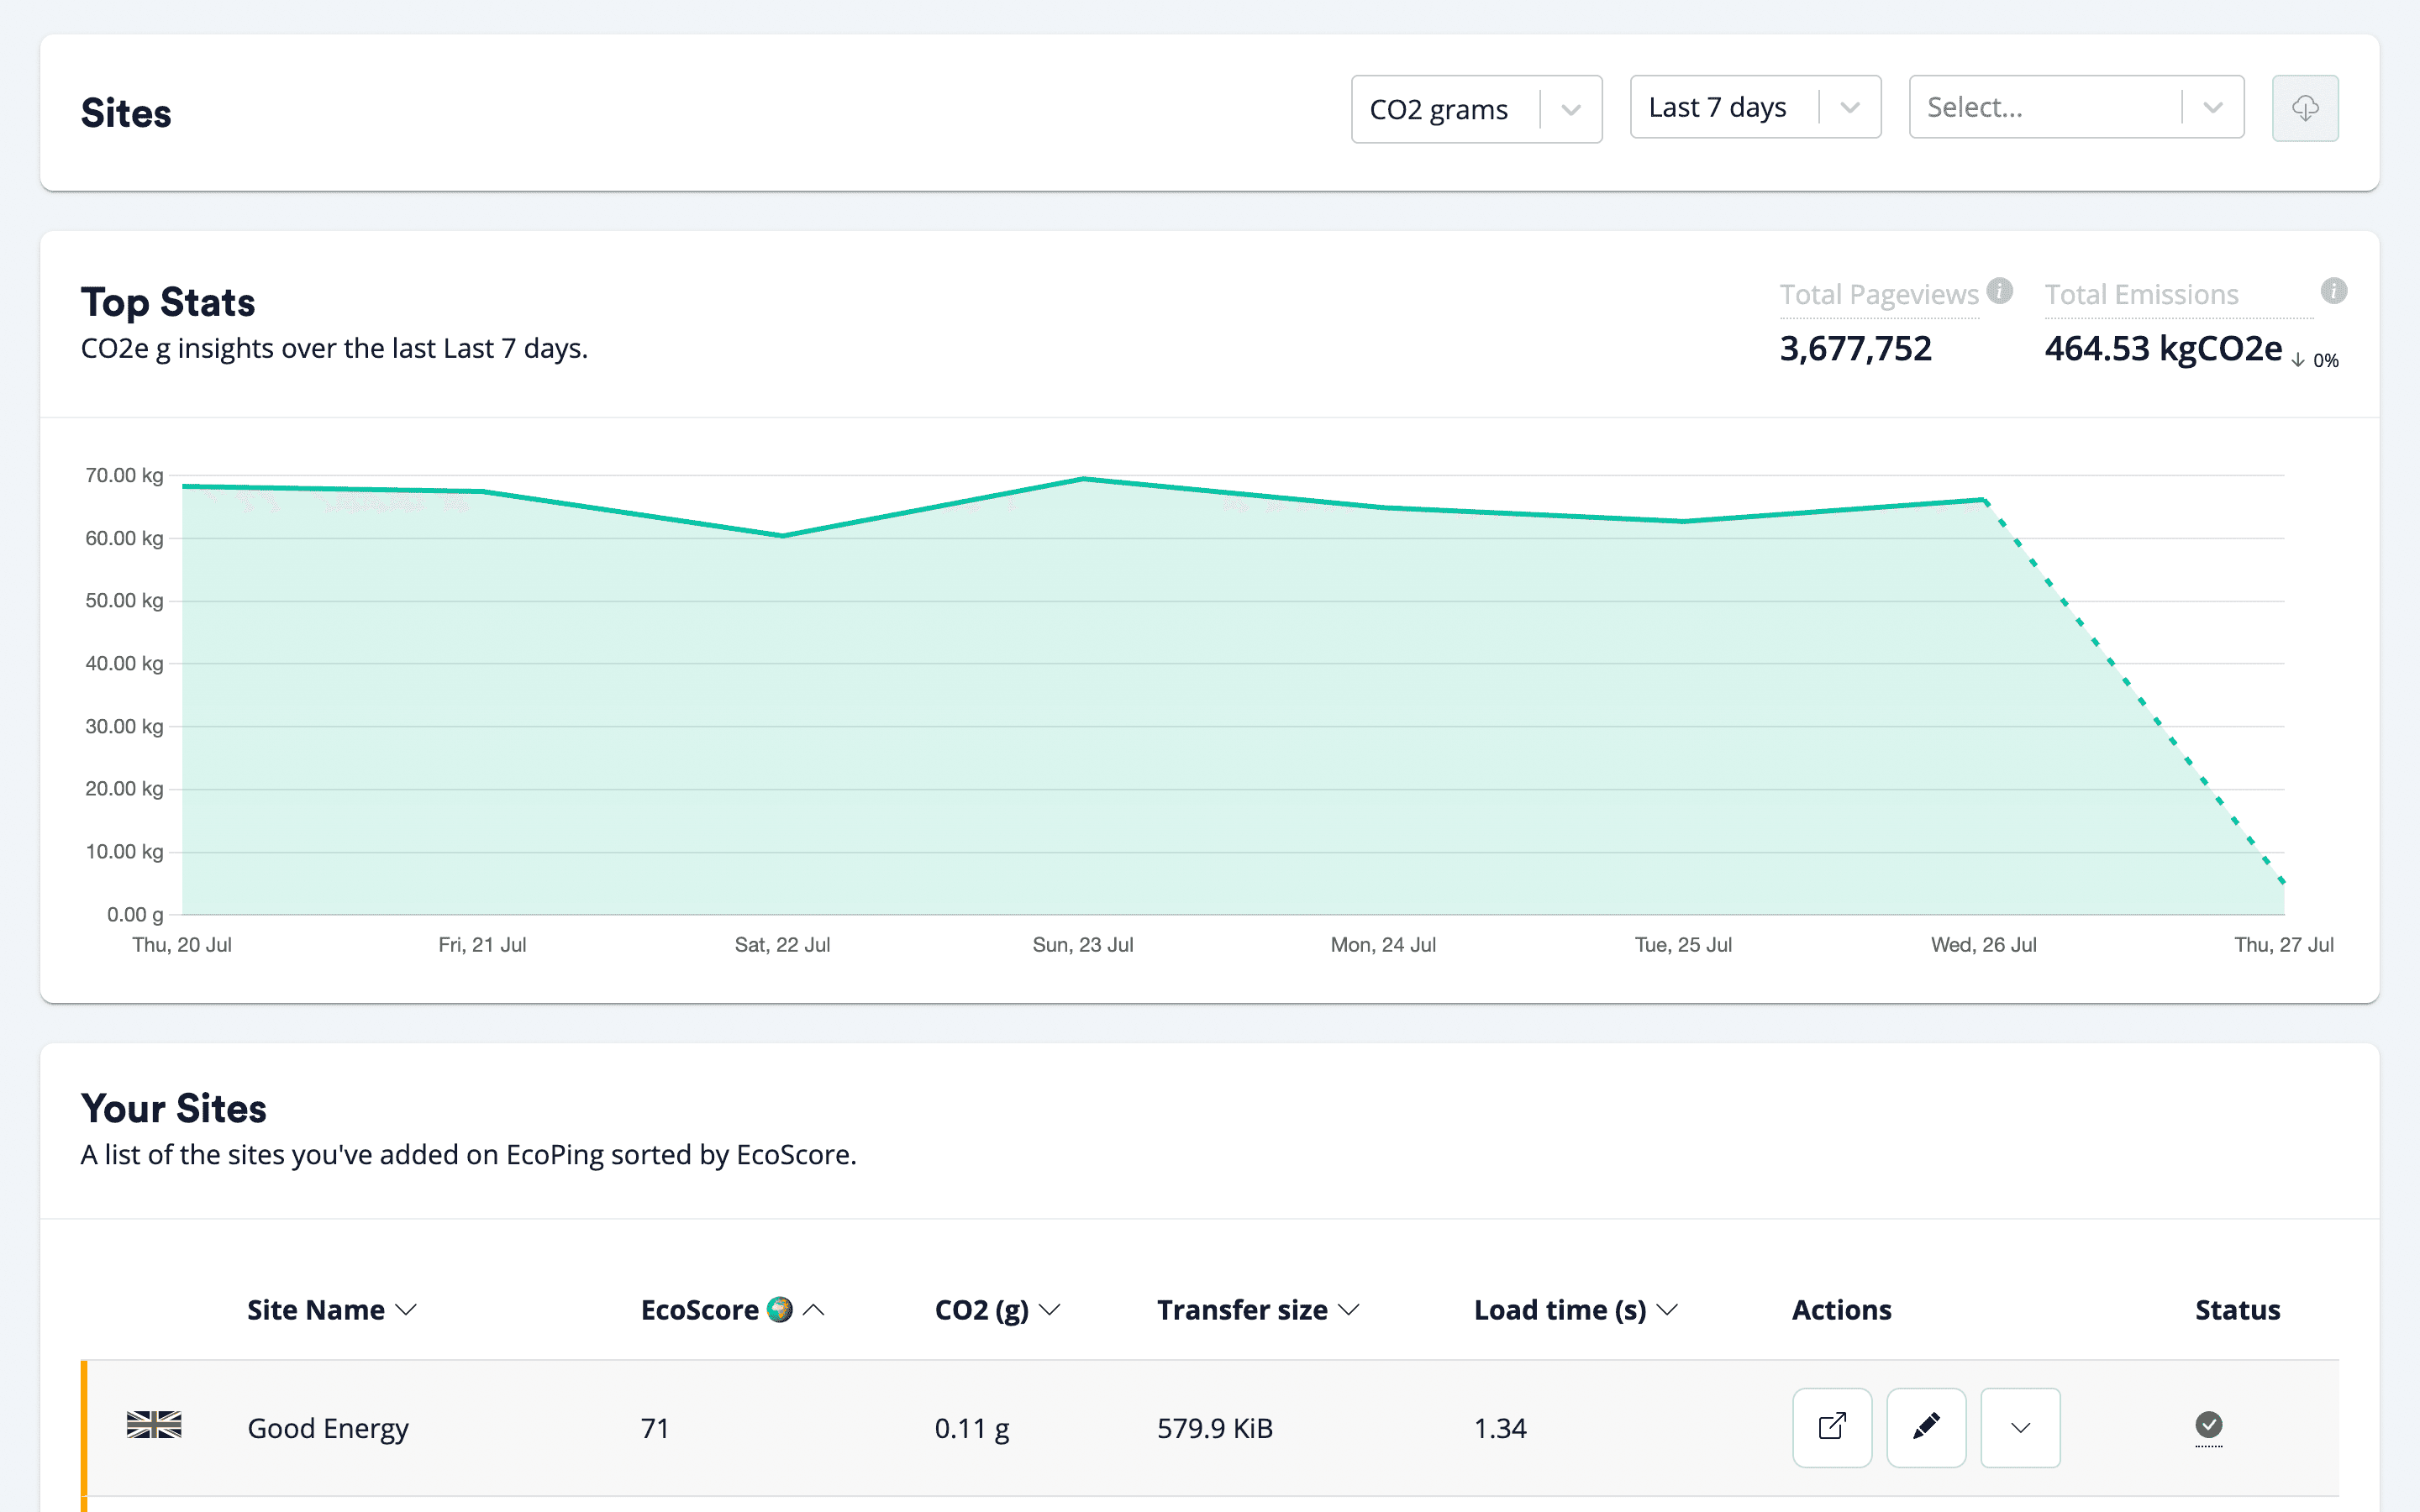
We've got all the features you need to start tracking your website carbon emissions all in one place.
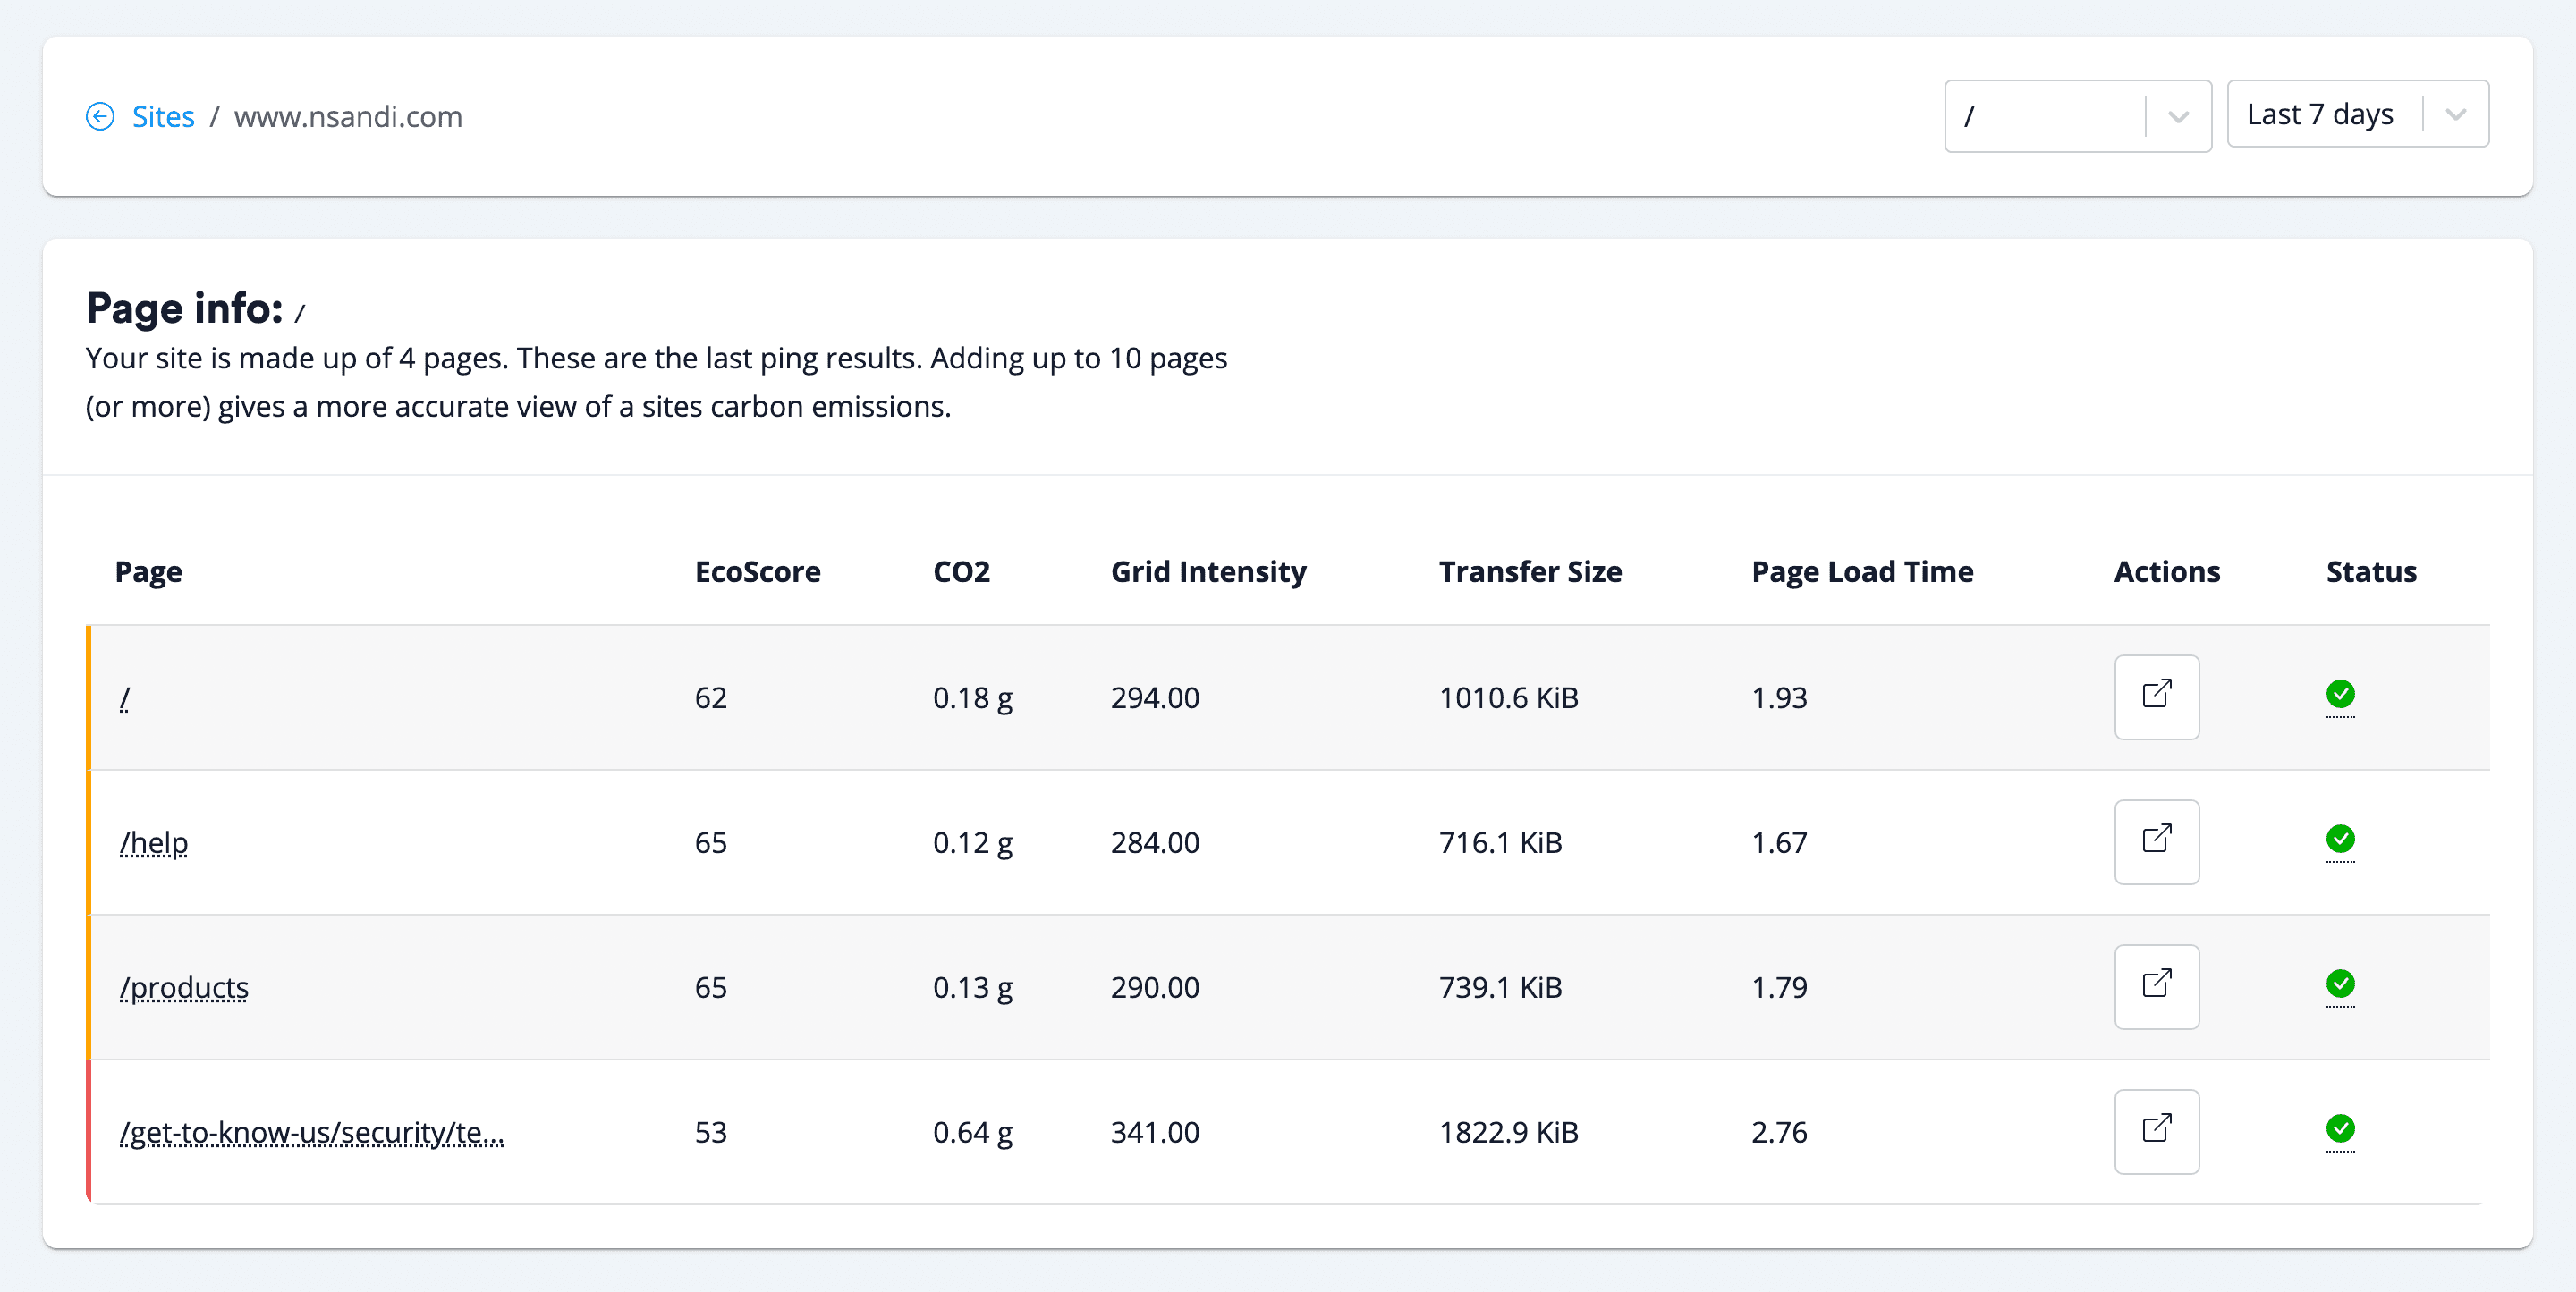
Our daily site checks make sure your website is performing the best it can over time. Resource breakdowns, carbon emission calculator, carbon comparisons and mobile data costs... all in one place.
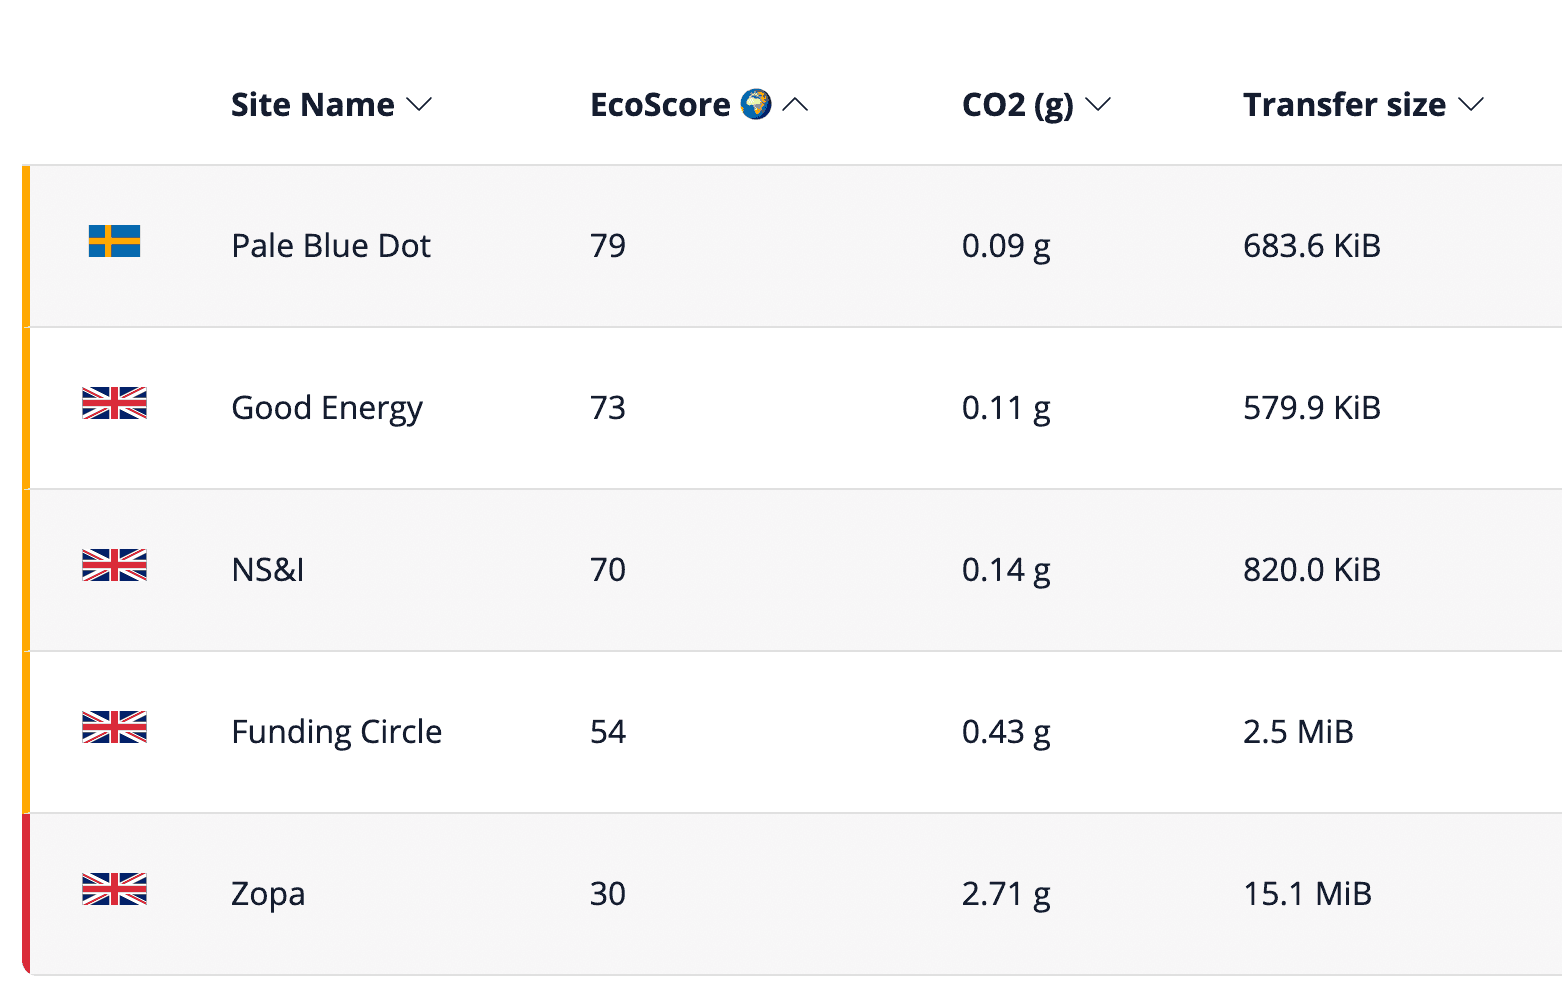
Seeing how your website compares to your competitors is a keep driver to help improve your website for key stake holders.
That is the same amount of CO2 saved each month as 5 flights from Amsterdam to New York (679 kg CO2 per flight). A great part about this is that it's instantaneous too. This would otherwise take 2.95 broad leaf trees 100 years to sequester the same amount.
Source: Danny Van Kooten
Seeing how your website compares to your competitors is a keep driver to help improve your website for key stake holders.
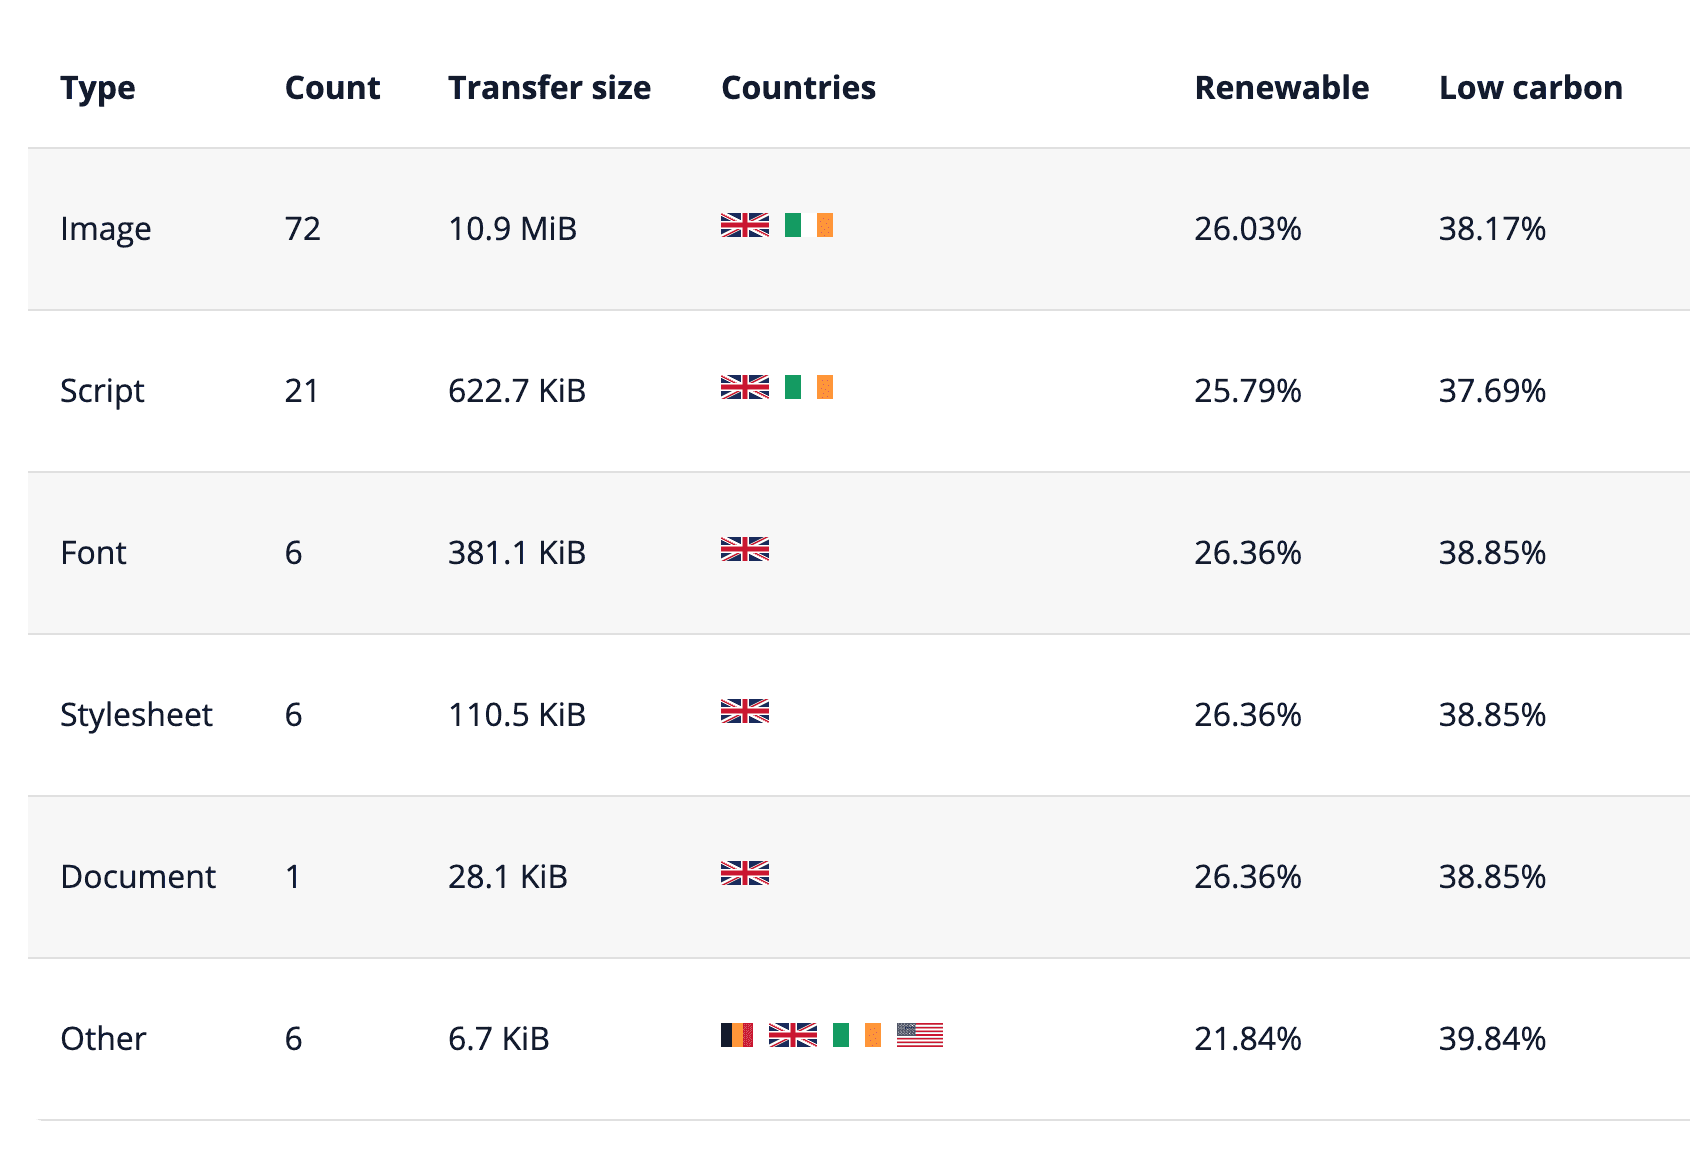
We track where your the resources that make up your website come from and see what the live energy production is like to determine if your website is hosted on renewables.
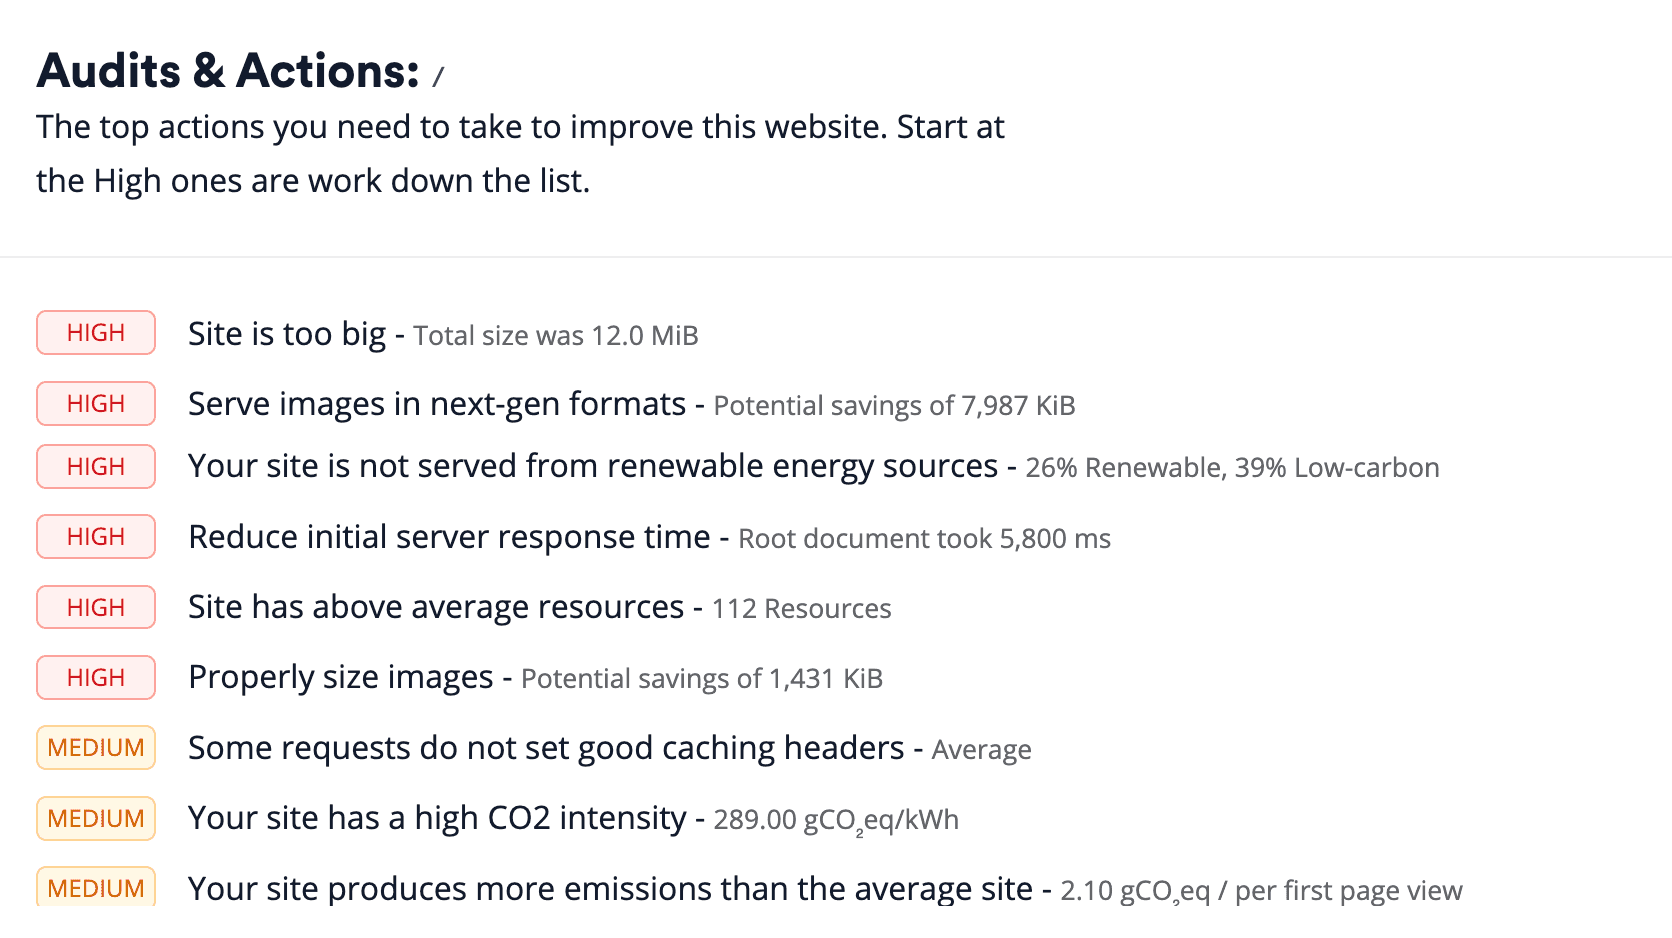
With each report we bake in Google's Lighthouse & Core Web Vitals to give key metrics and actionable tasks for your developers to improve the site.
Improving your company website with EcoPing is a win-win scenario.
Customer experience and website carbon emissions are the best of friends. That means when you choose measure and improve your website carbon emissions (that’s where our tools and reports come in) and think about sustainable web design, you’ll naturally gain wins in user journey, search engine ranking, bounce rates (that’s right, they’ll decrease) and therefore – drum roll – sales and conversions.
If you can think of a single reason not to give it a go, we’ll eat our environmentally friendly hats.
EcoScore EcoScore is our key metric to track how eco-friendly your website is. It's a score out of 100 (over 90 is the goal!) The EcoScore…
Read more »
About teams You can now create teams on EcoPing! Teams allow you to add websites to different…
Read more »
Keeping track of your website emission has got even easier with our new email notifications. We now send you weekly email reports when you…
Read more »
